December 11, 2024 | Revision 1 | Authored by Bob Dabkowski
Download a PDF Version Here:
Hint: it’s not when you think. Also: there’s an easier way.
Introduction – Why Should I Care?
It’s well known that every Activated Sludge treatment plant has a Solids Retention Time (SRT) or Mean Cell Retention Time (MCRT) “sweet spot”. When the plant is in that zone, sludge settleability is great; effluent quality is fantastic; and operations are smooth. But how small is that “sweet spot”? How does it change with the seasons? Can it be precisely measured?
Ammonia bleed-through (or nitrification for the non-nitrifying plants), bulky poor-settling sludge, increasing effluent suspended solids, clarifier denitrification, filaments and scum are indicators that the plant is outside the “sweet spot”. Does the SRT/MCRT need to be increased or decreased to get back to the “sweet spot”? How much of a change is required? Is the process control data accurate enough to make the right decision?
The Problem – Grab Sample Dilemma
At most facilities, every morning the operators grab samples for total suspended solids (TSS) testing: mixed liquor suspended solids (MLSS), waste activated sludge (WAS), return activated sludge (RAS), clarifier sludge concentration (CSC) and others. The MLSS, WAS and CSC are critical to understanding the solids inventory in the system, used to calculate the MCRT of the activated sludge process. Also calculated from the MLSS and WAS data is the aerobic SRT, critical to ensuring (or avoiding) nitrification. The most powerful process control decision is based on these datapoints – how many microbes to waste from the system. How reliable are these grab samples?
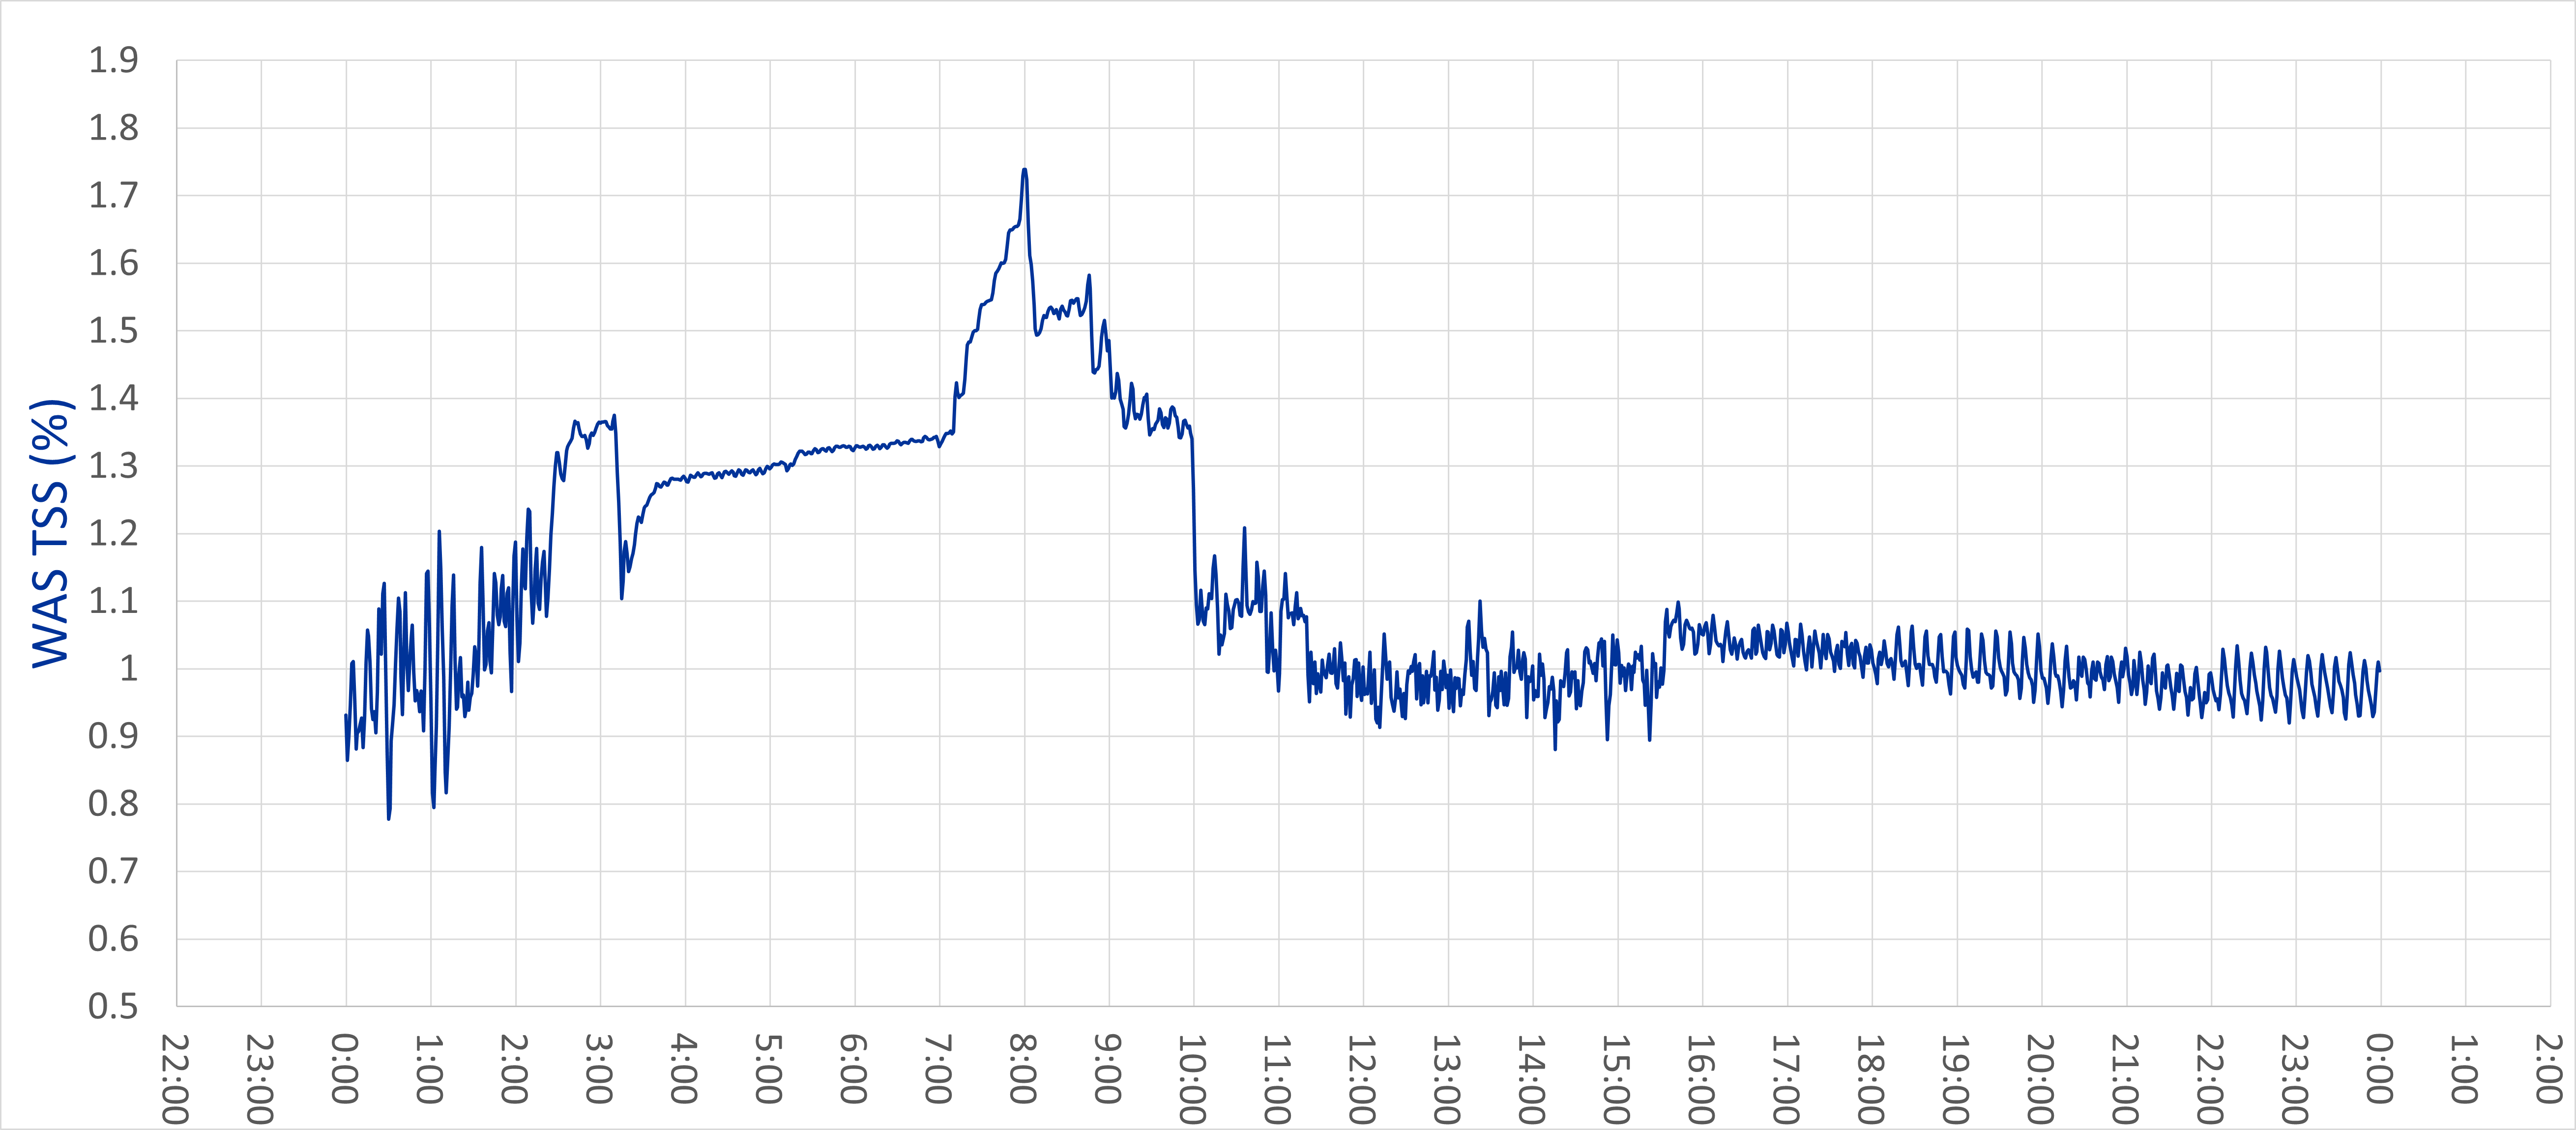
Grab samples are an instantaneous picture of the process – they are a “snapshot” of current conditions. If the process changes after the sample was collected, there is no way of knowing unless another sample is pulled. For example, the chart below shows WAS concentrations measured continuously over 24 hours by an online suspended solids probe – note the difference from 7 to 8am. At 7:00 the concentration is 1.33%, at 8:00 it’s 1.74% – 31% higher! How would that change wasting?
There can also be variability between operators pulling the samples and running the TSS tests to add significant errors to the results. Even with a certified lab and a skilled laboratory analyst, variability in the gravimetric TSS test has been observed up to +/- 15% when a MLSS sample has been repeated multiple times – how much error should be allowed for such a critical process control sample?
Hard Truth: Grab samples for MLSS and especially WAS/RAS don’t provide the complete picture that Operators need for Activated Sludge Process Control.
The Consequences – Filaments, Foam, Pinfloc, PAO/GAO
At least seven separate papers have been published that discuss the benefits of accurate and precise SRT/MCRT Control (references below). What does accurate and precise mean? Precise means the data and results are consistent – much like how a shooter can produce a tight group on the target, with minimal deviation. Accurate means the average of the results agrees with the goal – much like how a shooter produces a group around the bullseye. When you have accuracy combined with precision, you can produce a tight group, dead-center on the bullseye.

How accurate and precise does the SRT/MCRT need to be? This is a difficult question to answer as it depends on how “forgiving” is the specific activated sludge system. Some activated sludge processes can still perform well with +/- 0.5 days SRT/MCRT variability while others require a very strict +/- 0.03 days to meet their performance goals. From a microbe’s perspective in the activated sludge, less variability is better and variability should be reduced as much as possible. Remember, the amount of sludge wasted from the system defines the population of microbes in the activated sludge process. Big changes in wasting result in big changes to the microbial population!
Remember: The microbial population in the activated sludge process is defined by how much sludge is wasted from the system.
From those papers, here are the published benefits of accurate and precise (+/- 0.03 days) SRT/MCRT control:
- Improved Settleability/Reduced Bulking (Lincoln, NE)
- Prevention of Low DO, Low F/M and High F/M bulking (Ekster)
- Reduction of 0041 filamentous bacteria (Green Bay)
- Reduction in SVI from 148mL/g to 115mL/g (Bellingham, Ekster)
- Accurate SRT was above growth range of type 1701 and H. hydrosis but below nitrification cliff
- Decreased SRT variation/error from +/- 0.5d to 0.1d (15% of SP to 3%)
- Seasonally accurate SRT kept below growth range of type 1851 (VV, Ekster)
- Reduction in SVI from 225mL/g to 138ml/g
- Decreased SRT variation/error from +/- 0.9d to 0.15d (15% to 2.5%)
- Increased system stability (nitrification)
- Control of nocardiaform foaming – optimizing SRT to be below growth range (Sacramento, San Jose, Oxnard, San Francisco EBMUD, Ekster)
- SRT within +/- 0.03d and proper setpoint kept plant above dispersed growth and 60mg/L effluent TSS and below nocardioform foaming (EBMUD, Ekster)
- Elimination of M. parvicella foaming (along with trapping) (Bartle, 2014 Bozeman)
- Excessive chlorine consumption and coliform compliance issues, now solved through accurate and appropriate SRT control (Chico, Ekster)
- Increased secondary system capacity (Ekster)
- 25% increase (Bellingham, Ekster)
- 30% increase (Victor Valley, Ekster)
- Consistent solids yield and microorganism growth rate (Greenwood, 2002 Met Council)
- Very stable BNR operation
- Optimized Bio-P operation (Onnis-Hayden, 2013 Clark County)
- 6 d was optimal SRT for BioP at Clark County – removing most P and most stable
- Highest P release and P uptake at low SRT
- Highest PAO fraction: 17.5% at 6d but 12.8% GAO
- Lowest GAO fraction: 8.9% at 7d with 15.3% PAO
- Simultaneous P release and DN at 6d – seemingly no nitrate interference
Summary: An accurate and precise SRT/MCRT can increase the plant’s capacity, enhance biological nutrient removal, optimize settleability, and prevent some filamentous bacteria from proliferating.
First Step – Totalize the WAS
The simple solution to the variable grab sample problem is to pull more grab samples, and adjust wasting based on the updated data. While that may be simple, the additional burden on operators and lab analysts makes it anything but easy.
If the treatment plant currently operates on grab samples, the easy step is to totalize the pounds of solids leaving in the WAS in real time. Most facilities plants already have a flowmeter (or multiple flowmeters) on the WAS pipe – to totalize the pounds of solids leaving in the WAS, all that is missing is a suspended solids measurement.
To totalize the WAS, a simple program is added to a programmable logic controller (PLC) to multiply the gallons of flow from the last minute by the average WAS TSS concentration over the last minute, multiplied by 8.34 pounds per gallon – this calculates how many pounds were wasted in the last minute. Run the program again and add the results together – this is total pounds wasted in the last two minutes. Keep running the program and it will totalize the pounds of sludge wasted in real time.
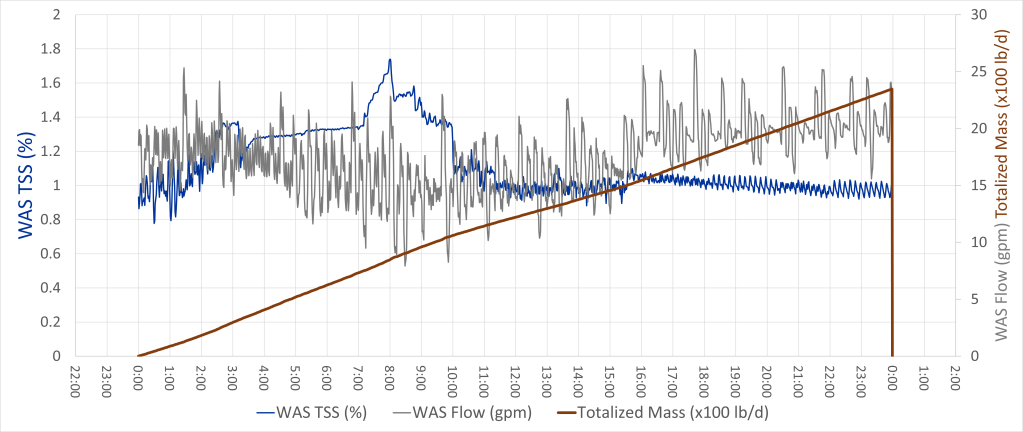
Here’s an example, based on the WAS data that was shown previously. Not only did this facility have variable WAS TSS concentration, but due to the design of the plant they also had inconsistent WAS flow. With all that variability, operators struggled to accurately calculate the pounds of solids wasted and therefore struggled to control SRT accurately. Totalizing the WAS completely removed the variability and now the operators know exactly how many pounds of solids were wasted that day: 2357.5 lbs.
If the MLSS concentration is stable at your facility, a system like this allows operators to be engaged in the SRT/MCRT calculation but have accurate and precise wasting data. The program can be expanded to stop wasting once the total pounds have been achieved for the day or adjusting the WAS pump speed, so the total pounds are wasted over 8, 12, or 24 hours, ensuring that the proper amount of solids are removed from the system.
Easiest Solution: Install a TSS sensor and totalize the pounds of WAS
Many different manufacturers offer TSS sensors that will accurately measure WAS TSS concentration in closed pipes. Maintenance requirements vary from little to moderate, but all require periodic verification against a grab sample and recalibration when the difference between the measured and grab samples are greater than 10%.
Most sensors have some method of automatic cleaning; air or water scour, wipers, and ultrasonic are common methods. Installation can affect sensor accuracy, thoroughly research the installation requirements and balance them against the desired accuracy and available budget. Some TSS sensors install like a flanged magnetic flowmeter, others can be installed through a pipe saddle and two-inch NPT nipple, while others require the fabrication of spool pieces with special insertion angles. Work with a consultant to decide which sensor is best for your facility.
Second Step – Automatic SRT/MCRT Calculation
Since the WAS is now totalized, the next logical step is to expand the program to automatically calculate yesterday’s SRT/MCRT and the SRT/MCRT averaged over the last number of days.
To accomplish this, one or more TSS sensors needs to be installed into the mixed liquor so that an average MLSS over the previous day can be calculated by the program. With the data collected, the program can calculate the average pounds of solids in yesterday’s mixed liquor by multiplying the average MLSS concentration by the volume of the reactors, multiplied by 8.43 pounds per gallon.
If suspended solids in the secondary effluent are a concern and need to be included in the pounds of wasted sludge, an additional TSS sensor is required. Like MLSS, the average effluent TSS concentration will be calculated by the program, then multiplied by the average daily flow (in MGD) and multiplied by 8.43 pounds per gallon to get the pounds of solids in the effluent.
To calculate yesterday’s SRT(MCRT), the program should divide yesterday’s MLSS (+ Clarifier) mass by the pounds wasted from the totalized WAS plus the effluent pounds.

TSS sensors for immersion into a tank or channel widely available. Their installation requirements are simple – pole mounting hardware mounted deep enough so the sensor stays submerged if liquid levels change. Just like with in-pipe TSS sensors, periodic maintenance is required, and the sensors need to be verified regularly and recalibrated periodically.
With this addition, operators remain engaged in the process control decisions and calculations – since the amount of mass to wasted still needs to be calculated based on the desired SRT/MCRT. However, now they have new tools to use in their decision making, based on data that is representative of the entire process, and not based on instantaneous grab samples. With these two building blocks in place, operators will become more comfortable with the additional information as they gain confidence in the underlying data.
Third Step – Automatic SRT/MCRT Control
Adding to the existing program to allow for automatic SRT/MCRT control is a straightforward process, however any successful automation project requires a plan to address the risks and benefits.
In Standards for Automation of Water Resource Recovery Facilities (WEF21-24), ten keys for successful automation projects are described in detail, and summarized here:
- System Advocate – someone technically competent, really excited about the project, and respected throughout the organization to lead the Task Force
- Management Support – must have the utility manager’s full support
- Owner Involvement – for large projects using outside resources, owners need to work closely with designers to ensure a successful project
- Operator Involvement – successful project means it is used for its intended purpose
- Stakeholder Involvement – who else should be consulted to ensure the project is a success?
- Maintenance Plan – includes system reliability issues, replacement parts, ongoing maintenance and training
- Full System Testing – complete control system testing and approval
- Contingency Plans – flexibility in design, budgets and schedules
- Training – should include multiple approaches
- Goals – create a written plan that states the tangible and intangible goals for the entire project
If all the keys are complete and consensus is built amongst the team, then amending the program to automatically control SRT/MCRT is ready to commence. The goal of the new program is to receive the operator’s desired SRT/MCRT setpoint for today, then calculate and control the mass of solids wasted from the system.
Before the calculations are programmed, a few important parameters need to be decided:
- Should MCRT or SRT be the goal? Can both be controlled, or does one need to be controlled and the other trended? Is the mass of solids in the clarifier(s) important to the activated sludge biology?
- Averaging data – a typical practice is to calculate today’s SRT/MCRT and then average it with the previous six days SRT/MCRT to reduce noise and variability (aka: a running seven-day average SRT/MCRT); how will the program handle this? What other data should be averaged, and what data NOT be averaged?
- Definitions – what is a “Day”? Is it midnight to midnight, 8am to 8am, or something else? What other terms need special definition?
- Limits – what limits should be put in place so that the automation won’t create problems with the process? Boundaries that not only avoid data entry errors (“Fat Finger”), but also include impacts to upstream and downstream processes. For example, if the WAS is sent into a sludge holding tank, is there a level sensor on the tank that should stop the wasting program when the tank is full? Does the plant only waste over a 6/8/12 hour period, so the program needs to waste all the sludge in that timeframe? What needs to happen if the WAS concentration gets too thin – should the program stop wasting at a concentration limit?
- Alarms/Notifications – what are the important (not nuisance) alarms or notifications that should be included in the program? If the WAS TSS sensor stops sending data, how should that be handled? If the MLSS sensor has a warning, should that be considered critical?
- Fallback Strategies – One benefit of automation is that critical faults can often be identified as they occur and are not reliant upon human identification. When a critical fault occurs, how should the program react? Fallback strategies should be clearly outlined for each fault that could occur, so that the process remains in control.
- What else should be considered that is specific to your plant?
Once the critical safety items are defined, the calculations can proceed. The best practice for most facilities is to use at least the last seven days averaged MLSS concentration to ensure smooth, consistent data in the program. More or fewer days can be used in the MLSS averaging, and the number of days to average can be an operator input to the program.
The operator inputs the desired SRT (MCRT) in days, and the program calculates the mass to waste today:

Now that the quantity of pounds to waste is known, the PLC can execute the wasting program. Wasting programs can vary from simple to extremely complex. A simple wasting program is defined as the operator opening the WAS valve, or starting the WAS pump and setting the flowrate, then allowing the PLC to totalize the pounds wasted and close the valve/stop the pump once the mass to waste setpoint has been achieved.
Complex wasting programs can include wasting the sludge from multiple locations within a certain time window (e.g. 8 hours), including limits such as sludge holding tank level, minimum waste sludge concentration, and many more. If your activated sludge process requires a complex wasting program, work closely with a consultant that understands both the process and the programming. This will ensure that the person performing the programming will have a clear understanding of what needs to be accomplished, which will lead to the program being delivered on time and under budget.
Conclusion
So, when is the best time to grab MLSS and WAS samples? The best time to grab samples is when they can be sampled properly, analyzed accurately, and used to verify (or recalibrate) the online TSS sensors that feed the SRT/MCRT program.
Begin by totalizing the WAS and expand the program as confidence grows in the data. With accurate and precise SRT/MCRT, the activated sludge system is stable, the microbial population is consistent, and operators have reliable, real time process control data that keep operations running smoothly.
References
Bartle, H., C. Revis. Controlling Microtrhix parvicella with Foam Control and “Ammonia-SRT”. Proceedings of the Water Environment Federation, WEFTEC Conference, 2014.
Basu, S., T. Wiesner, J. Page. Failure and Subsequent Restoration of EBPR Capability of a Small Community Wastewater Treatment Plant. Proceedings of the Water Environment Federation, WEFTEC Conference, 2008.
Ekster, A., D. Jenkins, J. Hagstrom. Optimization of the microbiological population using precise sludge age (SRT) control. Proceedings of the International Water Association, Instrumentation, Control and Automation Conference, 2017.
Greenwood, S., C. Anderson, M. Rieth, and T. Stein. Constant Hydraulic SRT Improves BNR Activated Sludge Performance. Proceedings of the Water Environment Federation, WEFTEC Conference, 2002.
Onnis-Hayden, A., N. Majed, D. Drury, L. Risso, K. McMahon, and A. Gu. Effect of Sludge Residence Time on Phosphorus Removal Activities and Populations in Enhanced Biological Phosphorus Removal (EBPR) Systems. Proceedings of the Water Environment Federation, WEFTEC Conference, 2013.
Pretorius, C., R. Appleton, S. Walker, E. Jorgensen, B. Stevenson and L. Bateman. Why SRT Control is Not More Widely Practiced and Three Ways to Fi It: Making SRT Control a Reliable Tool for Operators to Use. Proceedings of the Water Environment Federation, WEFTEC Conference, 2016.
Whitlock, D., R. Wilson, D. Kinnear. An Overview of the Lincoln, NE Nitrifying Activated Sludge System, Control of Filamentous Bulking with an Anoxic Selector and Enhancing System Performance with an Automatic Solids Retention Time Control System. Proceedings of the Water Environment Federation, WEFTEC Conference, 2002.
